Semiconductor Market Research Reports
Electronics.ca Publications is a world-class market research network and publishing company whose focus is technology and market research for the electronics industry. Our research network spans dozens of areas of electronics expertise, and taps the knowledge of researchers and analysts internationally. We deliver critical information on the semiconductor, advanced materials, nanotechnology, electronics manufacturing, wireless technology and converging markets.
Showing 1–12 of 28 results
-
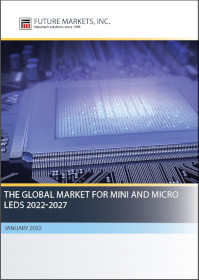
The Global Market for Mini and Micro LEDs 2022-2027
$1,400.00The Global Market for Mini and Micro LEDs 2022-2027
This report covers the market for Mini LEDs and Micro LEDs. The displays market is constantly advancing, with new technologies allowing for greatly improved brightness, HDR, and color reproducibility. Recently, miniLED and microLED have attracted major attention in the displays market and are being implemented in products by consumer electronics giants such as Samsung and Apple.
PDF file via Email. Published January 2022
190 pages, 42 tables, 85 figures.$1,400.00 -

Hot ICs: A Market Analysis of Artificial Intelligence (AI), 5G, CMOS Image Sensors, and Memory Chips
$4,950.00Hot ICs: A Market Analysis of Artificial Intelligence (AI), 5G, CMOS Image Sensors, and Memory Chips
This report examines in detail Artificial Intelligence (AI), 5G, CMOS Image Sensor, and Memory Chips (DRAM, NAND, NVM). Markets for the ICs and their applications are forecast to 2025, and market shares given in each sector. A profile of the IC manufacturers for each sector is presented.
PDF file via Email.$4,950.00 -
Nanomaterial Market Outlook: Solar Cells, Displays, Sensors, Lighting and RFID
$4,950.00Nanomaterial Market Outlook: Solar Cells, Displays, Sensors, Lighting and RFID
Eventually, nanomaterials are likely to affect nearly every industry in every region in the world, including the least developed regions. In fact, there is considerable optimism that nanomaterials will be instrumental in addressing some of the developing world’s most pressing concerns. Forecasts are presented for nanomaterials for solar cells, displays, lighting, and RFIDs devices.
PDF file via Email.$4,950.00 -

Metrology, Inspection, and Process Control in VLSI Manufacturing
$4,950.00Metrology, Inspection, and Process Control in VLSI Manufacturing
This report offers a complete analysis of the Process Control market, segmented as: Lithography Metrology; Wafer Inspection/Defect Review; Thin Film Metrology; and Other Process Control Systems. Each of these sectors is further segmented. Market shares of competitors for all segment is presented. *Includes excel spreadsheet of market revenues of each competitor in 22 segments from 2012 to 2020. Excel spreadsheet only available when ordering from this website*
PDF file via Email.$4,950.00 -

Mainland China’s Semiconductor and Equipment Markets: Analysis and Manufacturing Trends
$4,950.00Mainland China’s Semiconductor and Equipment Markets: Analysis and Manufacturing Trends
This 300+ page report analyzes Mainland China’s semiconductor and equipment industries, examining the technical, economic, and political issues that are shaping this nascent industry. Mainland China represents a huge opportunity for semiconductor manufacturers and equipment and materials suppliers. The emerging semiconductor market will exhibit growth far in excess of any other country.
PDF file via Email.$4,950.00 -

Mask Making, Inspection, and Repair: Market Analysis and Strategic Issues
$4,950.00Mask Making, Inspection, and Repair: Market Analysis and Strategic Issues
This report addresses the strategic issues impacting the mask making, inspection, and repair sectors of the semiconductor industry in the U.S. and the world. The mask making equipment markets are analyzed and projected. The photomask market share by supplier is presented on a geographic basis.
PDF file via Email.$4,950.00 -

The Global Market for Electronic Textiles (E-textiles) and Smart Clothing 2021-2031
$1,425.00The Global Market for Electronic Textiles (E-textiles) and Smart Clothing 2021-2031
Report contents include market drivers and trends in electronic textiles (E-textiles). Investment and product developments. Applications and markets including smart clothing products, heated clothing, sports and fitness, smart footwear, military, medical and healthcare, workplace monitoring & protection, motion capture, soft exoskeletons, wearable advertising and power sources for E-textiles.
Published: August 2021 | 215 pages, 54 Figures, 34 Tables
Enterprise-wide license. PDF download.$1,425.00 -

The Global Market for Nanomaterials 2021-2031
$2,180.00The Global Market for Nanomaterials 2021-2031
In-depth analysis of the global market for nanomaterials, producers, and products. Analysis of global demand, including historical data from 2010, and projections to 2031. Main application and product opportunities in nanomaterials. Profiles of over 950 nanomaterials producers.
Published: August 2021 | 1145 pages, 208 figures, 253 tables.
Enterprise-wide license. PDF via email.$2,180.00 -

Yearbook of World Electronics Data – Volume 1 2021 West Europe
$1,395.00Yearbook of World Electronics Data – Volume 1 2021 West Europe
Volume 1 of the Yearbook of World Electronics Data provides a single source solution allowing you to track the electronics industry in 16 countries in Western Europe, 13 major product groups, Market and production forecasts. A medium-term outlook for the West European electronics production through to 2024 by country.
Single User License. PDF via Email.
Publication Date: May 2021.$1,395.00 -
LED and OLED Lighting: Market Analysis and Manufacturing Trends
$4,950.00LED and OLED Lighting: Market Analysis and Manufacturing Trends
The High Brightness Light Emitting Diode (HB LED) market is exploding as unit shipments continue their upward growth. LEDs are creating a niche market for conventional suppliers of semiconductor processing tools. Markets for HB LEDs, backlight LEDs, and OLEDs are forecast.
PDF file via Email.$4,950.00 -

OLED and LCD Markets: Technology, Directions and Market Analysis
$4,950.00OLED and LCD Markets: Technology, Directions and Market Analysis
This technology-marketing report examines and projects the technologies involved in the fabrication of OLEDs and Liquid Crystal Displays (LCD). This report discusses the technology trends, products, applications, and suppliers of materials and equipment. A market forecast for display equipment and materials is presented. Markets for OLED and LCD displays are forecast, and market shares suppliers of these displays is presented.
PDF file via Email.$4,950.00 -

Indium Tin Oxide (ITO) and Replacements: Market Analysis and Trends
$4,950.00Indium Tin Oxide (ITO) and Replacements: Market Analysis and Trends
This report presents a market and technical forecast for ITO and replacements for LCD panels, plasma display panels (PDP), touch panels, e-paper, solar cells and organic electroluminescent (EL) panels.
PDF file via Email.$4,950.00
Showing 1–12 of 28 results